surface emg scan
Energy and Exhaustion
Dr. Roger Sperry, who won the 1981 Nobel Prize in Medicine, is credited with determining the “cost” of living in gravitational fields. To remain upright and move effectively, costs the body huge percentages of their neuromuscular energy, which in turn drains the body’s energetic reserves. When a nervous system is compromised by any or all of the three dimensions of stress: physical, emotional and biochemical, the natural neuromuscular response is one of protection. Muscles fire and contract. Joints lock and postures become flexed, tilted and rigid. The spinal system is pulled out of balance while constantly reacting to stress, making the entire body dysponetic or energy inefficient. It’s incredibly inefficient to have postural distortions and it is equally inefficient to remain subluxated. Both processes waste neuromuscular energy, disorganize the neuromuscular balance and exhaust the energetic reserves. Surface EMG is the ideal strategy for measuring the combined outcomes of postural and neuromuscular exhaustion.
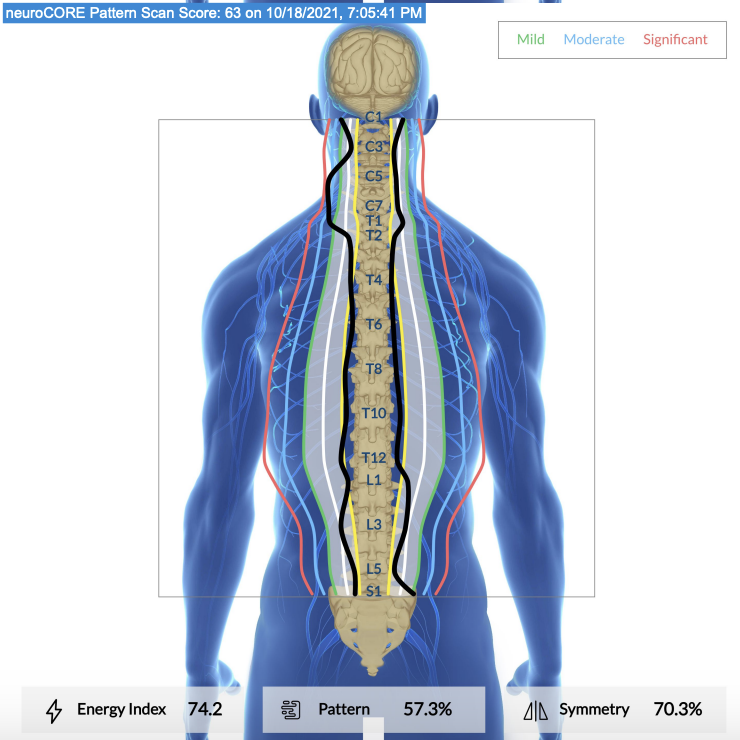
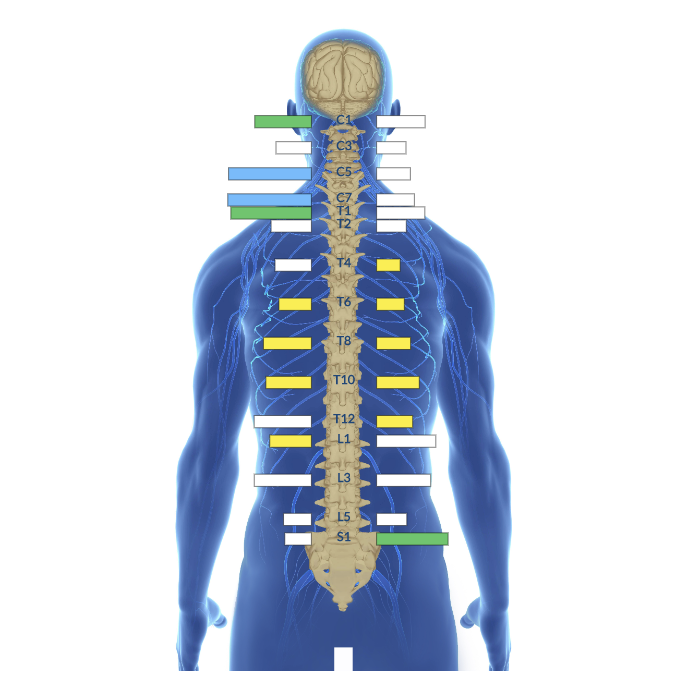
The best way to begin to visualize this wasted energy, distorted signal distribution and exhaustion is by viewing the EMG pattern graph (figure 1). The graph shows black lines on both the right and left sides of the spine. In a well-adjusted patient, these should be relatively symmetrical and should have consistent amplitude, meaning they should track as close to the white boundary line as possible. Green, blue and red boundaries are also there as guides to see where the energy is flowing out of the normal ranges, identifying dysponetic and potentially subluxated spinal regions. A yellow or hypotonic boundary also exists. It is particularly concerning to see these flattened line areas as they typically indicate a perpetually exhausted response.
Three calculations are also offered to assist in the interpretation. The total energy represents a metric based on an index where normal postural expenditure equals 100. Gross reactions in the neuromuscular system can cause this score to be many times higher than normal. The pattern score describes how efficiently the signals are distributed on the right and left sides, and finally the symmetry score describes how evenly the pattern is distributed at each level. Both pattern and symmetry score are percentiles.


